Model graph diagrams bridge the gap between standardized models that are commonly used in requirements engineering and A12 Models. They represent relationships between different data elements in a clear and easily understandable format. This perspective is employed to visualize and communicate complex data structures as encountered in mature business applications. How does the Data Modeling Perspective help in software modeling and communication with clients?
Short & concise
- In the mgm A12 Enterprise Low Code Platform’s SME, relationships between document and relationship models, such as references, are not visible in the file tree of the workspace view.
- This can pose challenges for business analysts, as the workspace often contains numerous models, making it difficult to track the modeled relationships.
- The Data Modeling Perspective of the Model Graph Diagram Editor enables a visual representation of the model graph in the SME workspace, where each node represents a document model, and each straight line represents a relationship model.
- The Data Modeling perspective in SME allows for the simultaneous opening of any model editor and a model diagram.
- Additionally, modeling can be done in the Data Modeling Perspective, and Model Graph Diagrams can be used to support the modeling of Composed Data Models.
Model graphs are composed of data entities and in model graph diagrams these data entities are represented as nodes or edges. This allows you to quickly understand the interactions and dependencies between the entities in your database and therefore the data structure of your application. A notable feature of model graph diagrams is the ability to create multiple diagrams effortlessly using an easy-to-use model editor to visualize and separately edit the different aspects of the complete model graph.
Data Models in the A12 Enterprise Low Code Platform
A12 Data Models, for instance, the Relationship and Document Models of a workspace, interact to form a model graph. These models are created and edited using the Simple Model Editor (SME), the core modeling tool of the mgm A12 Enterprise Low Code Platform.
- Document Models define entities as a hierarchy of data fields with associated validation and calculation rules.
- Relationship Models describe the connections between entities.
In the SME’s standard view, these models are presented as tree-like structures with editable elements. In practice, this form of representation and editing has proven effective. It visualizes the hierarchy of elements within a model and provides quick access to all displayed data fields.
But, in the SME workspace, relationships between documents and relationship models, such as references, are not displayed in the file tree. As the workspace typically contains many models, it can become difficult for analysts to keep track of the modeled relationships or, in other words, their model graph.
The Data Modeling Perspective: Integration of Model Graph Diagrams into the A12 Simple Model Editor (SME)
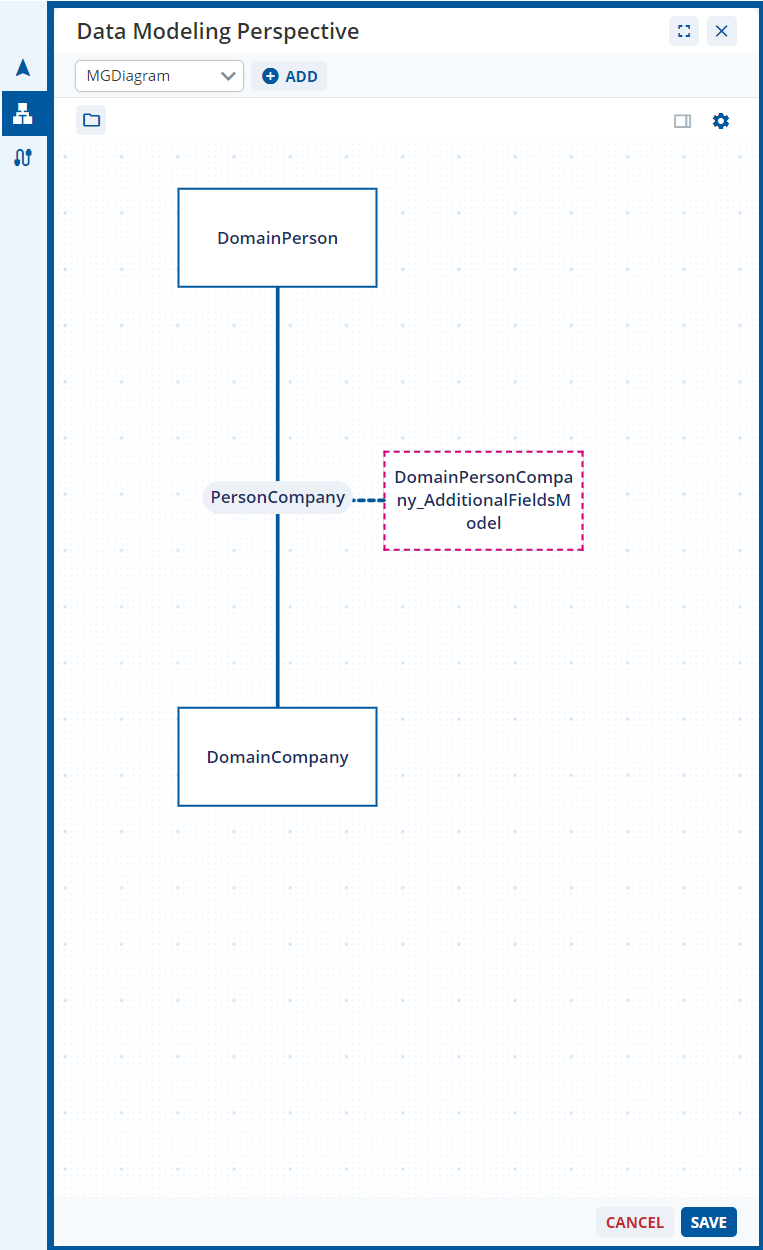
This is where the modeling perspective comes into play. It solves this problem by providing an additional visual representation with the Model Graph Diagram Editor that provides a graphical representation of the model graph in the SME workspace. Each node represents a Document Model. In addition, each solid edge in the diagram corresponds to a Relationship Model.
Malcom Cämmerer, Business Analyst on the Business Professional Services Team at mgm, explains:
“The data modeling perspective is the new part of the SME that we use to allow the integration of model graph diagrams into the Simple Model Editor. And it’s the S at the end of model graph diagrams that’s important because it allows us to create multiple model graph diagrams.”
With the data modeling perspective on the SME, it is possible to open any model editor simultaneously with a model graph diagram. Users can conveniently switch between the Workspace Explorer and data modeling perspectives using the tabs on the interface. These tabs provide a straightforward means of moving seamlessly between these central views within the workspace. “This allows users to better communicate with partners and colleagues”, says Cämmerer.
In addition, access to the data modeling perspective can be initiated by selecting any of the pre-existing model graph diagrams, enabling a quick transition to the data modeling perspective, thus enhancing the ease of workspace management. For example, when modeling a Tree Model, a model graph diagram can be created as a representation of the tree structure within the workspace.
Modeling with the Model Graph Diagram Editor
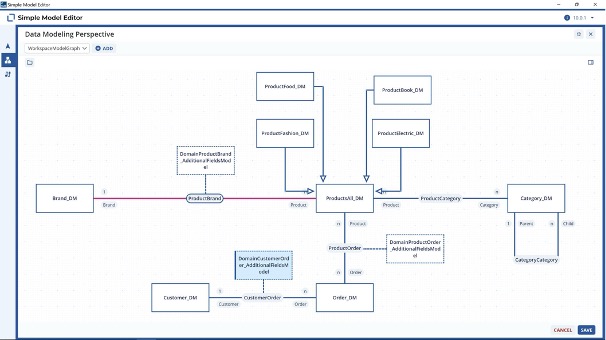
When working with the data modeling perspective, it is also possible to model. Users can add new document models and their relationships to gain a deeper understanding of the business contexts that underlie the business application. In the Model Graph Diagram Editor, users can visualize different facets of the modeled business logic and modify connections by drawing lines, with a particular focus on the data modeling perspective.
Changes in the workspace are reflected directly in the diagram, and vice versa. In addition to the graphical representation of the model structure, it is possible to make all model changes using the appropriate editors. Malcom Cämmerer explains:
“If I want to make a change to the way that I model my business domain, I can simply pick up that relationship and re-hang it on a new node. So, I can visually change the modeling of my data domain.”
In this way, the data modeling perspective serves as an alternative modeling option without forcing business analysts into diagram-based modeling.
How Does the Data Modelling Perspective Help You Communicate with Customers?
Malcom Cämmerer points out:
“The different diagrams can be used to create multiple perspectives of the modeled domain. Creating different perspectives through visualization with Model Graph Diagrams helps us to align and communicate individual modeling steps with partners and to clarify the meaning of each model.”
In addition, the Model Diagram Editor’s ability to directly edit models continues to improve. Previously, users could only visually add new relationship models as connections between existing document models, but now it is also possible to create new document models directly in the Model Diagram Editor. Furthermore, Model Graph Diagrams may now be used to support the modeling of Composed Data Models. The modeler simply clicks through the nodes and edges of the Model Graph Diagram to create the desired model.
Interested?
Discover the diverse possibilities of software modeling with the A12 Enterprise Low Code Platform. Find in-depth insights and establish a personal connection here.