Last Updated on 10. December 2025
In today’s increasingly digital and interconnected business landscape, software systems have become mission-critical assets that must deliver reliability, scalability, and long-term value. Organizations operating in complex domains—such as finance, public services, logistics, and enterprise operations—face the additional challenge of maintaining and evolving large, business-critical applications over many years. Ensuring consistent quality across these systems requires mature, data-driven Quality Assurance (QA) practices that support informed decision-making and effective risk management.
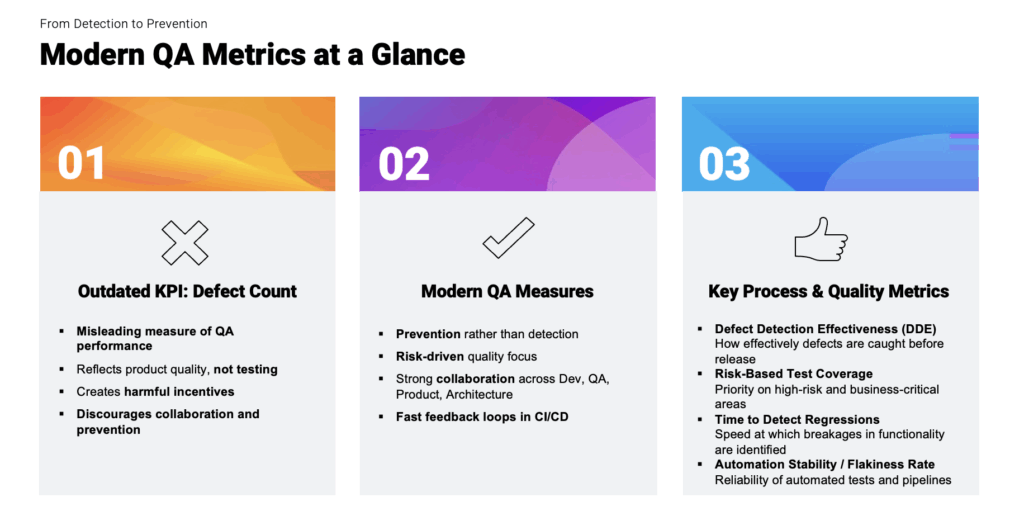
Yet, despite advances in engineering practices and quality frameworks, many organizations continue to rely on outdated metrics to guide their QA strategy. One of the most common—and most problematic—examples is using the number of defects found during testing as a primary indicator of quality or team performance. While intuitively appealing, this metric provides a narrow and often misleading view of product health, process effectiveness, and organizational maturity.
This article examines why defect count is an inadequate KPI for complex software ecosystems and highlights the risks associated with its continued use. It also outlines modern, value-oriented metrics that better reflect actual product quality, support continuous improvement, and align with the strategic objectives of organizations seeking to maximize quality while managing cost and effort. By adopting a more holistic measurement approach, enterprises can strengthen collaboration, reduce operational risk, and enable their teams to build software that delivers sustained business impact.
The Misconception Behind Defect Counts
The number of defects found reflects the quality of the product delivered to QA – not the efficiency of the QA team itself. Defect counts are driven primarily by factors outside QA’s control, such as
- the quality of the code developers produce,
- the clarity of requirements,
- the complexity of the feature set, and
- the degree of technical debt already present in the system.
A team may find very few defects simply because development delivered high-quality work. Penalizing QA for that is logically inconsistent. Conversely, a high defect count is often a sign of deeper issues in the development process, not evidence of superior QA performance.
Treating defect counts as a KPI also introduces harmful incentives. When teams are measured by how many defects they log, people naturally begin to optimize toward the metric instead of the outcome. This leads to inflated logging of trivial issues, duplicated tickets, or a focus on “easy wins” rather than on detecting high-impact problems. It also discourages early collaboration with development teams, because preventing defects before they occur reduces the defect count – thereby making QA appear less productive under a faulty metric. Instead of fostering a culture of joint quality ownership, defect counting pushes QA into a policing role that benefits no one.
Ironically, mature and highly effective QA organizations often discover fewer defects, not more. When QA participates early in requirement analysis, when teams engage in shift-left practices, and when automation systems and CI/CD pipelines are strong, many defects are prevented before they even reach testing. Strong collaboration across product, development, architecture, and DevOps leads to cleaner builds and more stable functionality. In such environments, a low number of defects is a sign of health, not inefficiency. Defect counting completely fails to capture this reality.
Beyond these structural flaws, raw defect counts ignore context. A single critical defect that causes data corruption is infinitely more important than twenty superficial user-interface inconsistencies. Yet defects numbers treat all issues as if they have the same weight. Organizations that rely on counts end up prioritizing volume over business impact, elevating noise and obscuring real risks. And since different codebases, team compositions, technologies, and release cycles all influence defect frequency, comparing defect counts across teams or projects is meaningless. It is like comparing rainfall across different cities and claiming the city with more rain is “better.”
What Meaningful QA Metrics Should Measure
Modern quality frameworks such as ISTQB and ISO/IEC 25010 emphasize that software quality is multidimensional and cannot be captured through simple defect counts. Empirical research further shows that defect numbers do not reliably correlate with product quality or process maturity.
If counting defects does not reflect QA efficiency, what should organizations measure instead? Effective QA metrics must focus on
- how well teams prevent issues,
- how quickly they detect and respond to risks, and
- how reliably the product behaves in real-world use.
These metrics fall into two main categories: 1. process and quality, and 2. outcome-based indicators.
Process and quality metrics show how strong the QA processes are. One of the most important is Defect Detection Effectiveness (DDE), which measures how many defects are caught before software reaches production. A high DDE indicates strong testing strategies and a healthy development pipeline, while a low DDE exposes gaps where defects escape and affect customers. Another essential metric is risk-based test coverage, which assesses whether QA is concentrating their efforts on the most critical, complex, and high-risk areas of the system instead of attempting to test everything equally. This ensures that testing resources are used where they deliver the greatest value.
Time to detect regressions is another vital process metric. It reflects how quickly the team or automation suite notices when a new change breaks existing functionality. Faster detection means less expensive fixes and shorter release cycles. This metric provides insight into automation maturity and CI/CD effectiveness. Also useful is tracking requirements clarity and feedback loops. When QA must frequently request clarification or corrections to requirements, it signals that risk is being detected early. This “shift left” quality work dramatically reduces later rework. Finally, automation stability, often measured as a flakiness rate, indicates the reliability of automated tests. Unstable tests undermine confidence, generate noise, slow down pipelines, and waste valuable development and QA time.
Outcome metrics reflect the real-world quality of the product. Production defect density, for example, measures how many issues users encounter after release. This is among the most telling indicators of the overall effectiveness of the entire delivery pipeline. Mean Time to Detect (MTTD) shows how quickly the organization identifies newly introduced defects. Faster detection means issues can be handled before they escalate. Related to this is Mean Time to Confirm (MTTC), which measures how quickly QA is able to reproduce and validate reported defects, whether they come from developers, support teams, or customers in production. MTTC reflects the responsiveness and efficiency of the triage workflow. Finally, the critical defect leakage rate reveals how many high-severity issues escape into production – arguably the most important reflection of how well risks are understood and mitigated during development and testing.
To use these metrics effectively, organizations must treat them not as tools for comparing teams or assigning blame but as instruments for continuous improvement. Metrics should be applied to identify trends, highlight bottlenecks, and guide strategy. They should be visible across teams and used as the basis for collaborative discussions, not as simplistic performance scores. When used correctly, these indicators help engineering teams allocate testing efforts strategically, strengthen automation, reduce rework, and improve product stability.
Moving Beyond Defects Counts Toward Meaningful Quality Measurement
In the end, relying on defect counts shifts the focus away from prevention and process improvement toward reactive defect reporting. A defect count measures symptoms, not causes. It neither reflects true product quality, nor the effectiveness of QA, nor the team’s contribution to value creation. Real quality emerges from the interplay of internal quality (code-structure, maintainability, testability), external quality (how the system behaves in operation), and perceived quality from the user’s perspective. An organization that only counts defects ignores these essential dimensions and inevitably fails to improve overall quality in a systematic way. Modern QA is therefore preventive, value-adding, and quality-assuring, not backward-looking defect tallying. While defect counts offer only retrospective symptoms of issues that have already occurred, process, quality, and outcome metrics provide early, proactive, and controllable indicators that enable real improvement. Effective quality assurance shapes the delivery process, safeguards requirements across all quality dimensions, minimizes risks, increases efficiency, and ensures that software remains sustainably maintainable and genuinely valuable.
Discover how Q12 puts prevention, collaboration, and data-driven quality at the center of software delivery. Visit our Q12 pages.
FAQ: Meaningful QA Metrics Beyond Defects Counting
Why is the number of defects found not a suitable QA metric?
Because defect counts primarily reflect the quality of the code delivered to QA — not QA efficiency. They are heavily influenced by factors outside QA’s control (e.g., code quality, clarity of requirements, technical debt).
What problems arise when defect counts are used as a KPI?
Defect counting creates harmful incentives, leads to ticket inflation, shifts focus away from actual risks, and hinders collaboration between QA and development. It measures quantity instead of impact.
Why do strong QA teams often find fewer defects?
Mature teams work with shift-left practices, are involved early in the process, and prevent defects before they occur. Low defect counts can therefore signal high product quality.
Which QA metrics are meaningful?
Important process and quality metrics include:
– Defect Detection Effectiveness (DDE)
– Risk-based test coverage
– Time to Detect Regressions
– Requirement clarity & early feedback loops
– Automation stability (flakiness rate)
– Which outcome-based metrics matter?
These include:
– Production defect density
– Mean Time to Detect (MTTD)
– Mean Time to Confirm (MTTC)
– Rate of critical defect leaks
How should metrics be used within an organization?
Not to evaluate or compare teams, but to support continuous improvement: identifying trends, bottlenecks, and risks, and helping optimize processes and collaboration.
What is the main takeaway of the article?
Defect counting is a misleading KPI. Modern QA measures prevention, risk management, process maturity, and product reliability.