Last Updated on 24. November 2025
What challenges exist in modern software testing projects? How does a Result Map work? And what added value does it provide in software test cycles? This article explains the importance of visualization in the testing process. Using the Result Map in the Q12-TMT Test Management Tool as an example, it showcases an innovative, visual method for monitoring test progress for test teams: it consolidates manual, automated, and other test results into an intuitive graphic that both testers and management can instantly understand.
The Key Question in Software Testing: “Where do we really stand in the test run?
Anyone who has ever had to quickly assess the test progress of an ongoing software project knows the problem: the information exists, but it’s scattered, nested, and far from user-friendly. You scroll through tables with hundreds of test cases, each status spread across countless columns. Automated test results are stored elsewhere, usually in different tools, with varying structures and presentations.
But it could be much simpler: A quick look at the test management tool, a central screen that compactly and visually presents the current test status in a way that’s also suitable for management.
That’s exactly what the Result Map delivers.
Challenges in Modern Software Testing Projects
Test management is much more than just executing test cases. In agile projects with short cycles (e.g., two-week sprints) or in large rollout projects with multi-month cycles, complexity rises rapidly:
- Which tests have already been executed?
- Where are the error clusters?
- Are there critical paths that haven’t been tested yet?
- Where do we urgently need to follow up?
These questions must be answered regularly—not just by testers, but also by project leads, quality managers, for management, and for external stakeholders.
The Solution: Visualizing Test Progress with the Result Map, Not with Lists
This is where the Result Map provides decisive added value. It visualizes test suites from a test run, as well as their folders and test cases, as interconnected nodes—a kind of “firework graphic” that is not only visually compelling, but more importantly easy to grasp at a glance.
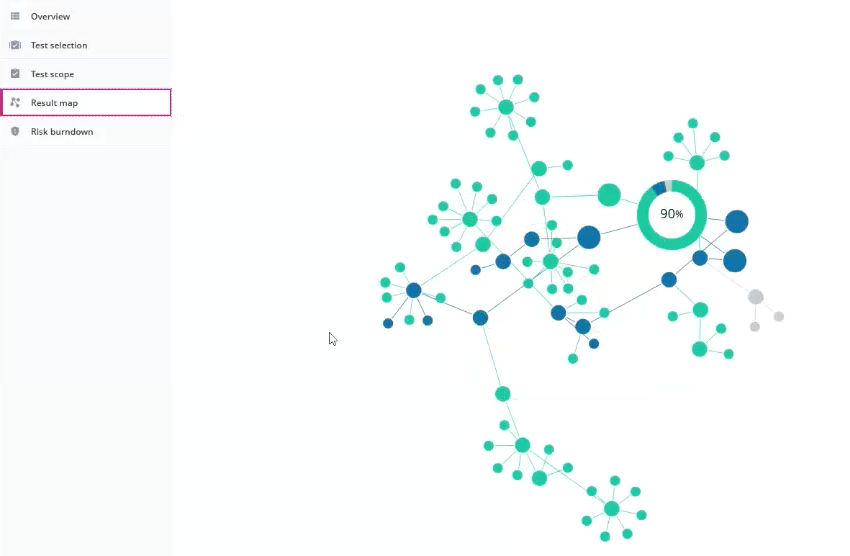
At the center is a ring chart that displays the overall test run progress as a percentage, segmented by status categories:
- Passed
- Failed
- In Progress
- Not Yet Tested
From here, the structure branches out like a tree down to the individual test cases. Node and connection colors follow a clear logic, allowing intuitive understanding of the current status at every hierarchy level.

This visualization is based on the results of all manual and automated tests executed in a test run. In addition, results from other test types such as performance or security tests can be included. The result: an aggregated view of the current test execution status. The map also addresses the key question at the end of a test cycle: Is the software ready for go-live?
The Added Value of Visualization for Stakeholders in Software Testing Projects
For Testers
- Quickly identify untested or error-prone areas.
- Grouping enables more targeted testing, particularly important with high volumes of test cases.
- Visual clarity during sprints, crucial for short feedback cycles.
For Project Leads and Test Management
- Planning security and prioritization of personnel and technical resources.
- Risk-based steering by identifying “hotspots” (clusters of failed tests).
- Status communication at management level with the Result Map, making it perfect for project status reports—it translates complex test data into clear visuals.
For Clients and Stakeholders
- Progress in quality assurance is understandable and measurable, fostering transparency and trust.
- Early risk identification, allowing critical issues to be addressed before go-live.
- Professional reporting instead of endless test lists and multi-page PDF printouts.
What Other Visualizations Are Useful for Software Test Teams?
In addition to the Result Map described here, test risks can also be visualized. For more insights, see the article No Risk, More Fun: Finding the Right Way to Represent Software Testing Risks.
Practical Example: Result Map in the Q12-TMT Test Management Tool
The Q12-TMT Test Management Tool (link) offers scalable test management for complex IT projects. This example shows the standard Result Map as a screenshot.
The Result Map is available in every test run via the “Results” menu. Sorting, grouping, and display follow the well-known structure in test selection, so there’s no learning curve.

More than 120 internal software development projects at mgm already use this tool and visualization. Our clients also actively use the map in their own Q12-TMT instances and benefit from the increased transparency in test cycles.
FAQ about the Result Map in Q12-TMT
What does the Result Map in Q12-TMT Test Management Tool display?
It visualizes test suites, folders, and test cases as interconnected nodes and consolidates both manual and automated test results.
What types of tests does it include?
Besides manual and automated tests, performance and security tests can also be integrated.
Who is the Result Map for?
The result map in Q12-TMT test Management Tool is dedicated for testers, project leads, management, and stakeholders—essentially anyone who needs a quick overview of test progress.
Is training required to understand the Result Map?
No. The result map follows the familiar test structure in Q12-TMT and is intuitive to use.
Conclusion: The Result Map as a Strategic Tool for More Overview, Control, and Quality
With the Result Map, software test teams can take another step toward proactive, risk-based quality assurance in test processes. As software release cycles become increasingly complex and fast-changing, overview is a strategic advantage!
Try Result Maps in the Q12-TMT Test Management Tool for Free Now!
The Q12-TMT Test Management Tool for professional software test management brings transparency and speed to test processes. Developed by experts for experts—with intelligent workflows that noticeably reduce testing effort.
Start for free, try out Q12-TMT Test Management, and connect directly with Oliver Storch on LinkedIn to dive deeper into this topic!